Bitcoin Price Prediction: Will It Plunge 50%? In-Depth Analysis of Technical Indicators and Bottom Targets
Current Bitcoin market overview
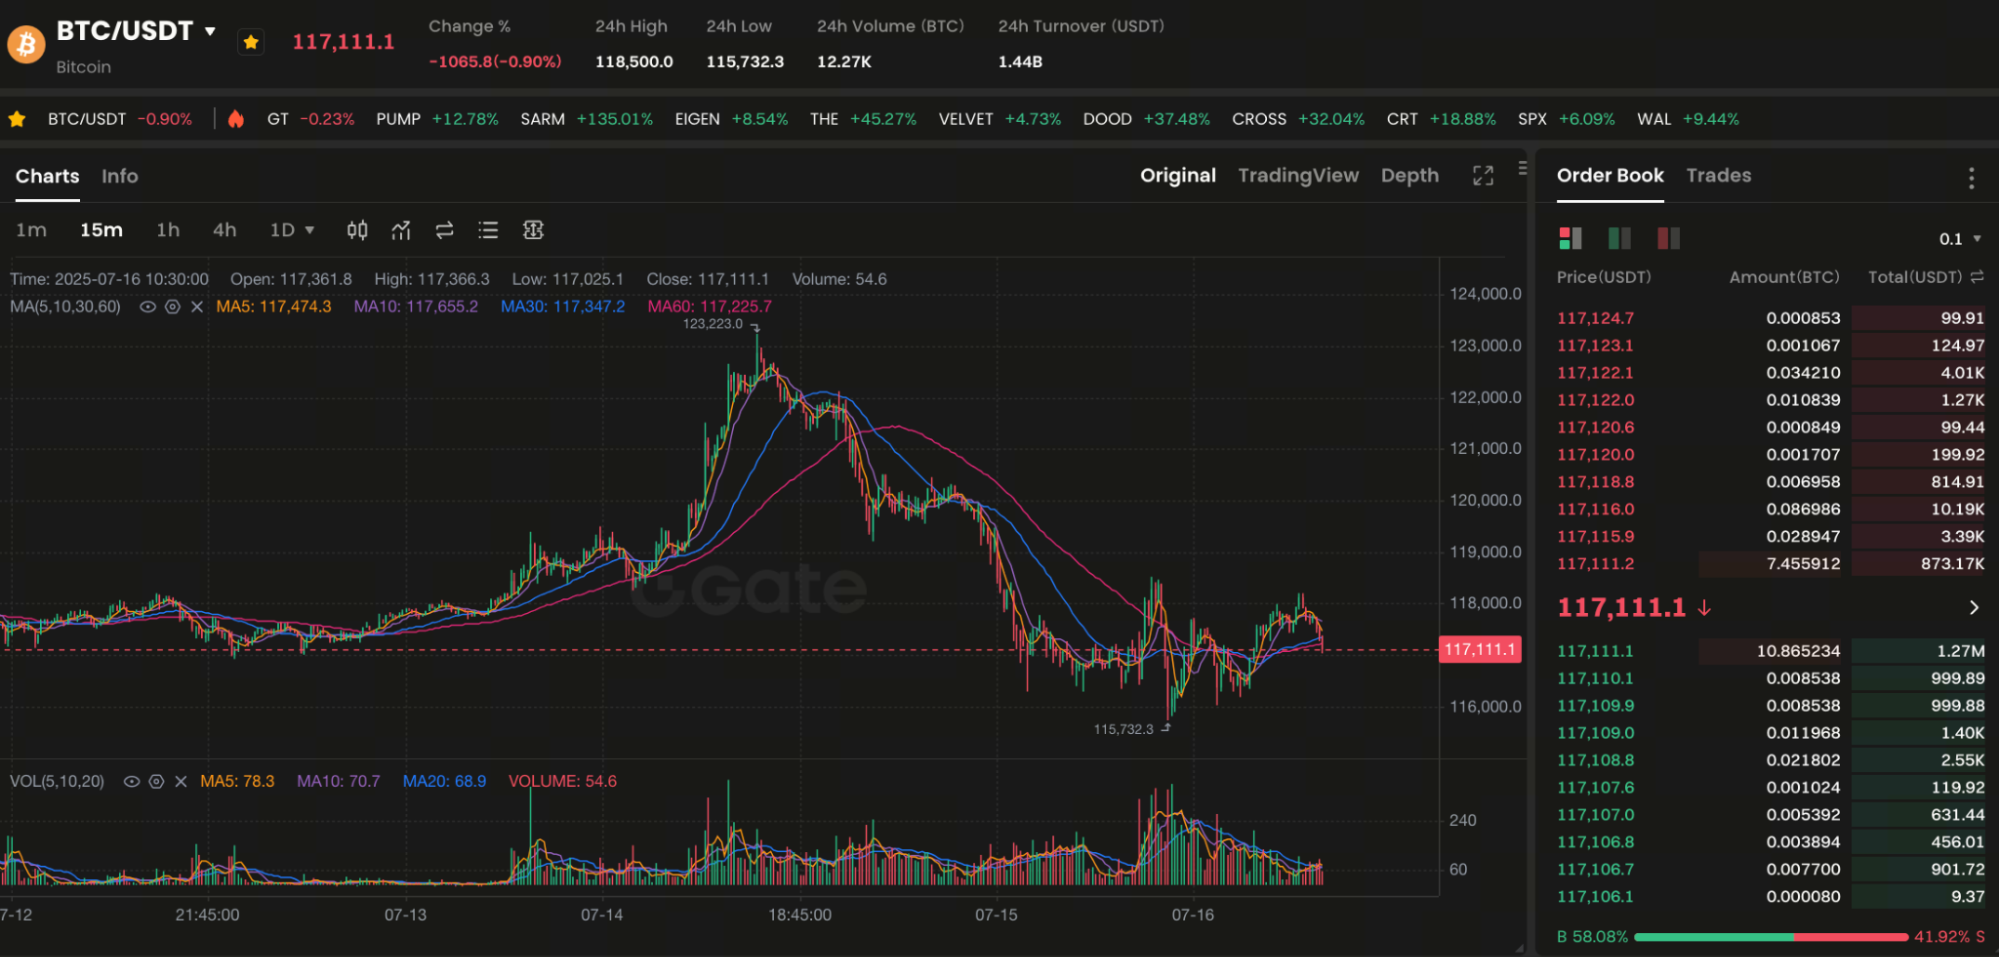
Figure:https://www.gate.com/trade/BTC_USDT
As of July 16, the price of Bitcoin has remained in the range of $117,000-$119,000, down more than 5% from the previous historical high of $123,091. Although the long-term bullish sentiment remains, recent data shows that market momentum is weak, with trading volume continuing to decline, reflecting a lack of buying power in the short term.
Analysis of Trading Volume and Momentum Indicators
FriendlyRox pointed out that the last three big dumps of Bitcoin were accompanied by a decline in trading volume and RSI divergence. This round of market is similar:
- The daily trading volume has dropped from an average of $125 billion in June to around $96 billion;
- The RSI (Relative Strength Index) quickly fell after reaching 74 on July 10;
- MACD signal bars weaken, indicating a lack of strength in price increase.
These technical indicator changes indicate that the “50% Bitcoin Price Crash” is not without basis.
50 EMA and Key Support Level Analysis
The technical chart shows that Bitcoin is currently above the uptrend line since the end of 2024, but if it falls further below $110,000, the next support will be at the intersection of $90,000 and the 50-day Exponential Moving Average (EMA). The bottom area that FriendlyRox believes—$60,000—is just below the historical support level of that moving average, which is also the previous bull market high.
Analyst Prediction Logic Interpretation
FriendlyRox’s predictions are mainly based on the following three points:
- The market is thinly traded at high levels, making it susceptible to bearish pressure.
- The growth of ETF holdings is slowing down, and institutional fund attitudes are conservative;
- Bitcoin price has strayed too far from the 50 EMA, which may lead to a technical mean reversion.
History also shows that the two rounds of big dumps in 2021 and 2022 occurred after BTC increased by more than 3 times, and the current stage is highly similar.
How should investors respond?
In the face of a potential 50% pullback, novice investors can refer to the following strategies:
- Gradual position building/profit-taking and stop-loss mechanism improvement: Set trading plans with support at $105,000, $90,000, $75,000;
- Hedge risks with options tools: use put options to protect long positions;
- Reduce leverage, retain cash flow: control risk exposure and enhance the safety of funds.
- Extend the investment period and reduce the impact of fluctuations: long-term regular investment can smooth out the risks brought by price fluctuations.
Conclusion
The “50% Bitcoin Price Crash” is not an exaggeration, but a possible market correction path. As a novice investor, it is important to understand the technical indicators and market mechanisms, carefully formulate investment strategies, and reasonably allocate positions to cope with potential price fluctuations in the future.
Related articles

Pi Coin Transaction Guide: How to Transfer to Gate.io

What is N2: An AI-Driven Layer 2 Solution

Grok AI, GrokCoin & Grok: the Hype and Reality

Crypto Trends in 2025

What is Official Elon Coin (ELON)?
