Gate Research: BTC Hits New Highs, ATR Breakout Strategy Yields 200% Return
Preface
This biweekly quantitative report (July 1–14, 2025) focuses on the market performance of Bitcoin (BTC) and Ethereum (ETH), providing a data-driven analysis of key indicators such as long-short ratios, futures open interest, and funding rates to interpret the broader market dynamics. The strategy section of this report highlights the practical application of the ATR Breakout Strategy across the top 10 cryptocurrencies by market capitalization (excluding stablecoins). It systematically outlines the strategy’s logic, signal identification rules, and execution workflow. Through parameter optimization and historical backtesting, the strategy demonstrated strong stability and execution discipline in both trend recognition and risk management. Compared to simply holding BTC or ETH, the strategy achieved better performance in both return enhancement and drawdown control, offering a practical and valuable reference framework for quantitative crypto trading.
Summary
- Over the past two weeks, the crypto market has shown a bullish bias overall. BTC continued to break out and set new all-time highs, supported by a healthy capital structure and technical setup, solidifying its position as the market leader. ETH, by contrast, remained range-bound with weaker momentum and trading volume, and limited willingness from the market to chase higher prices.
- Long-short ratios and futures positioning indicate a neutral-to-bullish sentiment for BTC, while ETH flows remain cautious. Although leverage participation has picked up, funding rates continue to hover near the neutral line, reflecting an overall cautious market sentiment.
- Liquidation data shows that BTC’s price rally has been driven more by short squeezes rather than aggressive long chasing. This indicates a rational market structure with a foundation for sustained upward movement.
- On the policy front, the U.S. has extended tax cuts, clarified the review path for crypto ETFs, and launched the “Crypto Week” legislative process—all of which support liquidity and market confidence.
- Quantitative analysis highlights the ATR Breakout Strategy, which generated over 200% cumulative returns in XRP by using a breakout-based approach—demonstrating strong short-term trading potential.
Market Overview
To systematically present the recent shifts in capital behavior and trading structure within the cryptocurrency market, this report analyzes five key dimensions: price volatility of Bitcoin and Ethereum, the long-short ratio (LSR), futures open interest, funding rates, and liquidation data. Together, these indicators provide a comprehensive view of current market dynamics, capturing price trends, investor sentiment, and risk conditions. The following sections will examine the latest developments in each metric since July 1.
1. Price Volatility Analysis of Bitcoin and Ethereum
According to CoinGecko data, BTC has shown a steady upward trend, rallying from around 110,000 USDT at the beginning of the month and breaking through multiple key technical resistance levels to reach a new all-time high of 123,000 USDT on July 14, demonstrating strong bullish momentum. Short-term moving averages remain in a bullish alignment, and the MACD indicator continues to expand, reflecting a healthy technical structure. On the volume side, buying activity has intensified during upswings, while pullbacks have seen mild volume contraction, indicating continued market confidence.
In contrast, although ETH began to rebound in late June, it entered a consolidation phase after reaching a local high of 3,065 USDT on July 11. While the price remains within an upward trend channel, MACD has shown signs of bearish divergence, suggesting weakening short-term momentum and cautious sentiment toward chasing higher prices. Since July 12, ETH’s trading volume has steadily declined, further signaling a rise in market hesitation and lack of fresh breakout momentum. 【1】【2】【3】
On the policy front, positive developments continue to support risk assets. On July 4, Trump signed the One Big Beautiful Bill Act, extending tax cuts for both corporations and individuals, and increasing spending on defense and infrastructure—reviving investor appetite for risk assets. While medium-term inflation pressures remain a concern, the short-term effect is expected to boost liquidity in the crypto market.
On the regulatory side, the SEC released ETF guidance on July 7, outlining clear filing procedures and review standards. Major institutions such as Fidelity and Grayscale have since updated their applications, supporting the compliant expansion of on-chain asset ETFs. Starting July 14, the U.S. Congress launched “Crypto Week,” during which lawmakers will review several key bills, including the GENIUS Act (stablecoin regulation), the Clarity Act (regulatory jurisdiction), and an anti-CBDC proposal. Overall, market sentiment has turned increasingly positive. 【4】【5】
In summary, BTC continues to break new highs, with strong technical structure and trading momentum, signaling a solid uptrend. ETH, by contrast, is consolidating near the top with weakening momentum and cautious sentiment in the short term. Meanwhile, the U.S. is releasing supportive policies on both fiscal and regulatory fronts, significantly boosting market expectations and likely injecting greater liquidity and compliance confidence into the crypto space—supporting the continuation of a bullish market structure.
Figure 1: BTC broke through key resistance levels and hit a new all-time high of 123,000 USDT on July 14; ETH shows weakening momentum, with conservative sentiment toward chasing highs.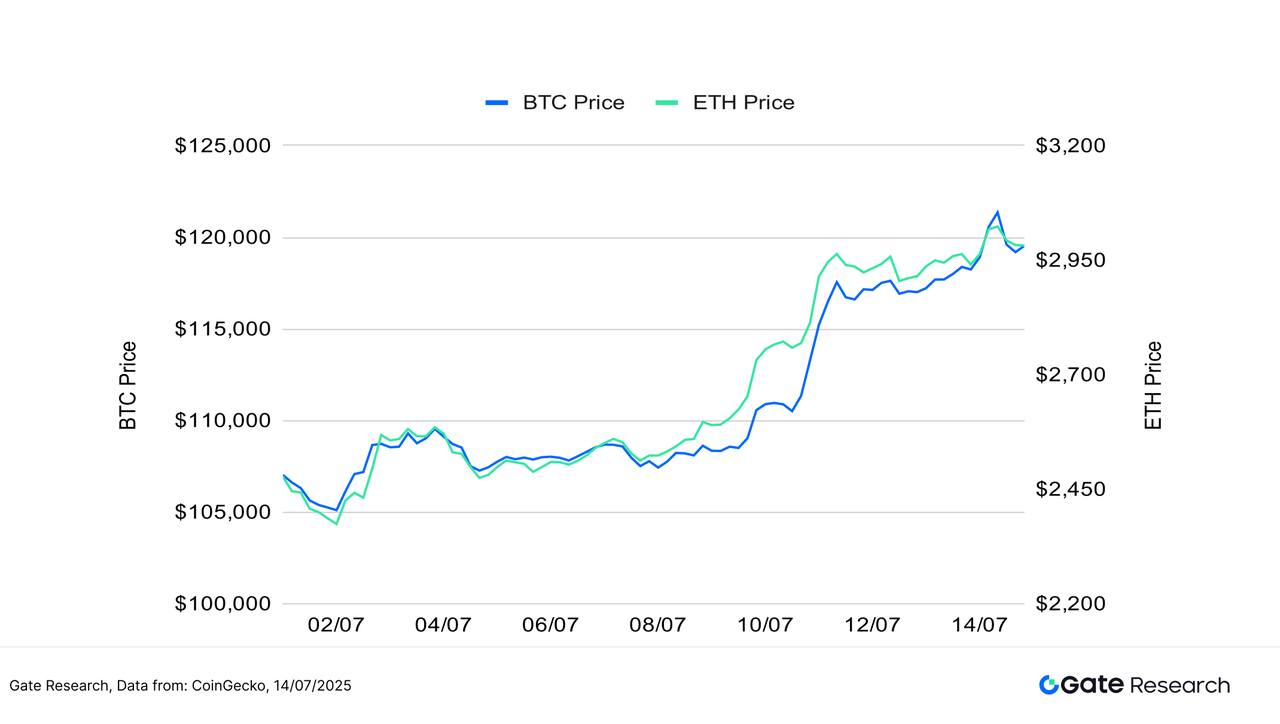
In terms of volatility, BTC experienced several brief spikes while consistently pushing to new highs, but its overall rhythm remained stable—indicating strong participation from major players and a clearly defined market trend. In contrast, ETH’s volatility began to rise rapidly starting July 12, reaching a local peak on July 14. This reflects greater uncertainty and speculative behavior surrounding ETH’s outlook, with capital flows showing more short-term and exploratory characteristics.
Overall, both BTC and ETH volatility remain within historically low-to-mid ranges, but ETH has seen repeated volatility surges, signaling that short-term price swings remain a concern. If accompanied by increased trading volume, these moves could lead to a decisive breakout in either direction.
Figure 2: BTC volatility remains relatively stable, while ETH volatility spiked noticeably in mid-July, reflecting growing market disagreement and speculative sentiment regarding its breakout direction.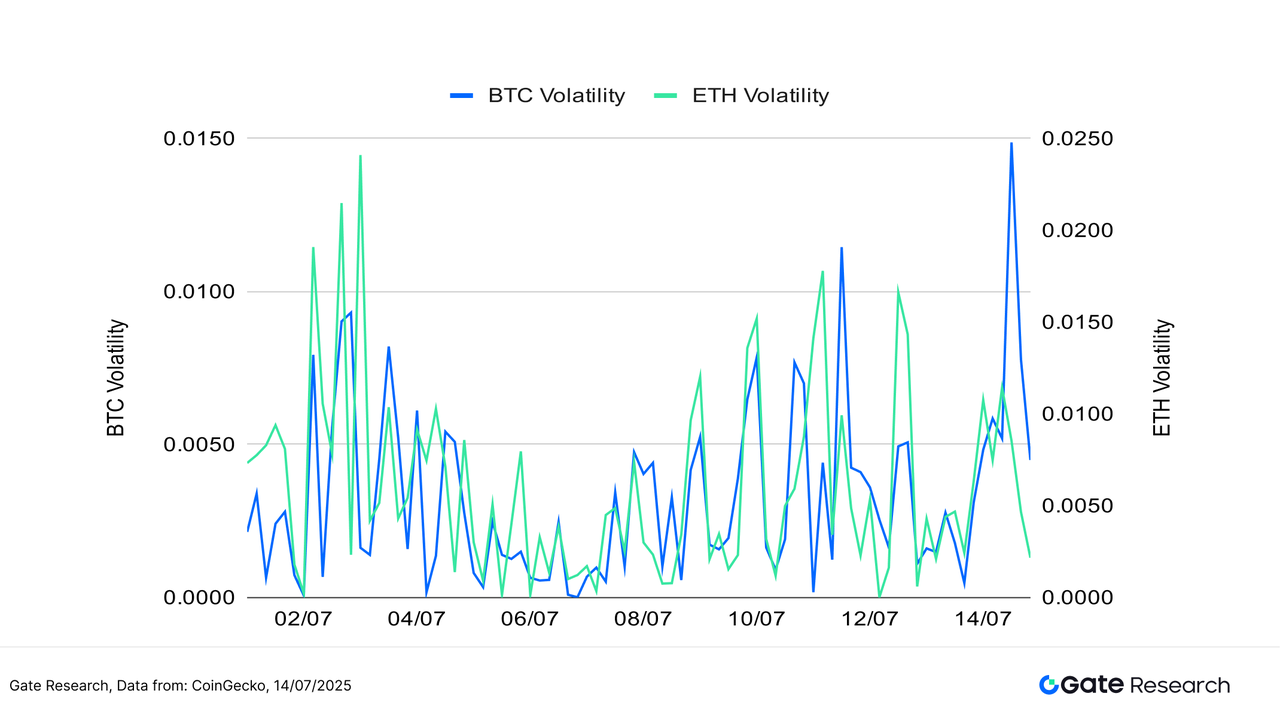
Over the past two weeks, the crypto market has generally maintained a bullish bias, with BTC showing strong and steady upward momentum, breaking through key technical levels and setting new all-time highs. Both its capital structure and technical setup remain healthy. While ETH has also rebounded, it has been consolidating near its recent swing high, with slower momentum recovery. Market sentiment has turned more cautious, and there is limited willingness to chase prices higher.
In terms of volatility, BTC’s price action has remained relatively stable, with only a brief spike on July 14, which quickly subsided. In contrast, ETH’s volatility spiked multiple times in mid-July, indicating greater market uncertainty about its direction, and suggesting that recent trading behavior has been more short-term and exploratory.
On the policy front, the U.S. has issued both fiscal and regulatory signals supportive of the crypto market, providing short-term liquidity and boosting risk appetite. These developments are expected to strengthen the medium-term foundation for continued market gains.
2. Analysis of Long/Short Taker Size Ratio (LSR) for Bitcoin and Ethereum
The Long/Short Taker Size Ratio (LSR) is a key indicator that measures the volume of aggressive buying versus aggressive selling, often used to gauge market sentiment and trend strength. An LSR greater than 1 indicates that the volume of market buys (aggressive longs) exceeds that of market sells (aggressive shorts), suggesting a bullish market bias.
According to Coinglass data, BTC continued its strong upward trend, reaching a new all-time high on July 14. During this period, the long-short ratio (LSR) generally remained at a neutral-to-bullish level. Although the ratio briefly surged to around 1.15 on July 11, indicating a rise in short-term market optimism, it quickly retreated within a day—suggesting that investors remained cautious about chasing the rally at higher levels. Still, since July 10, the long-short ratio has mostly stayed above 1, even during brief dips, reflecting ongoing market confidence in BTC’s medium-term outlook.
Meanwhile, ETH’s price also rebounded steadily to around 3,000 USDT during the same period. However, its long-short ratio mostly oscillated between 0.95 and 1.05, lacking a decisive breakout. This indicates that capital positioning at higher levels remains conservative and cautious. Overall, BTC’s capital momentum aligns more closely with its price trend, while ETH shows hesitation in both trading volume and sentiment. Short-term momentum for ETH remains relatively weak. 【6】
Figure 3: BTC continued its strong upward momentum and reached a new all-time high on July 14, with its long-short ratio remaining at a neutral-to-bullish level.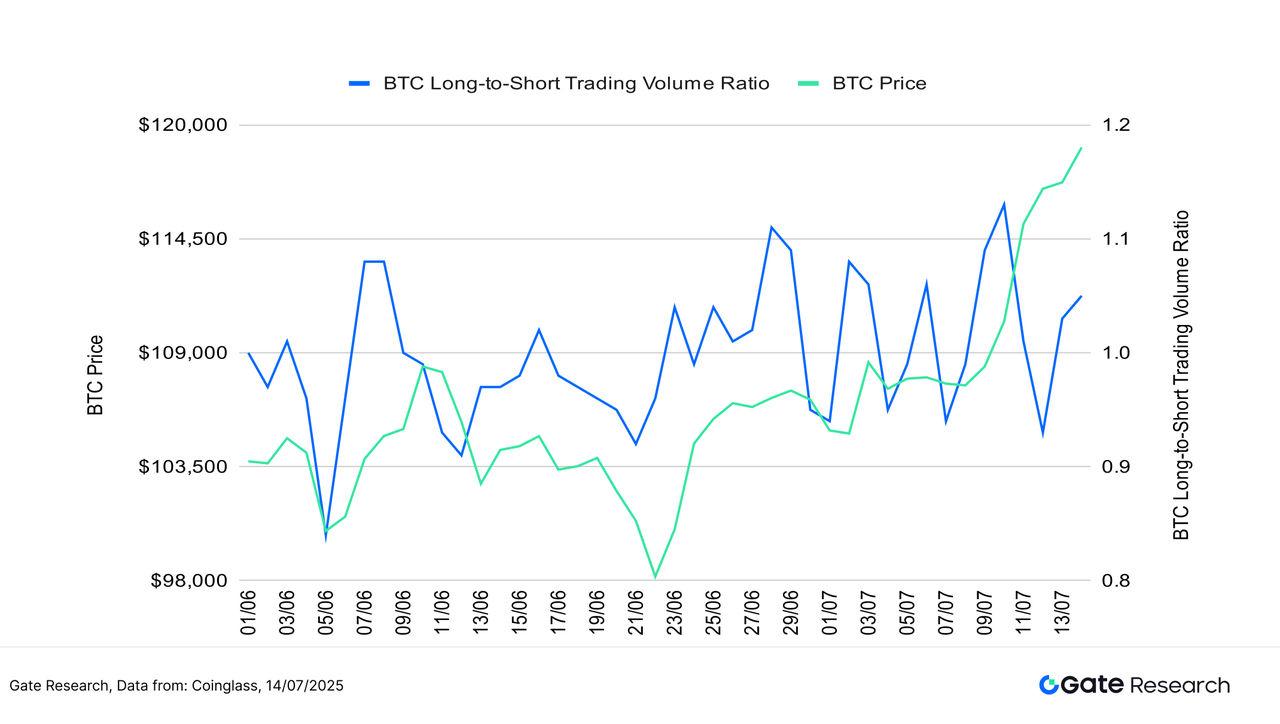
Figure 4: ETH price steadily rebounded to around 3,000 USDT, while the long-short ratio fluctuated between 0.95 and 1.05, lacking a clear directional breakout.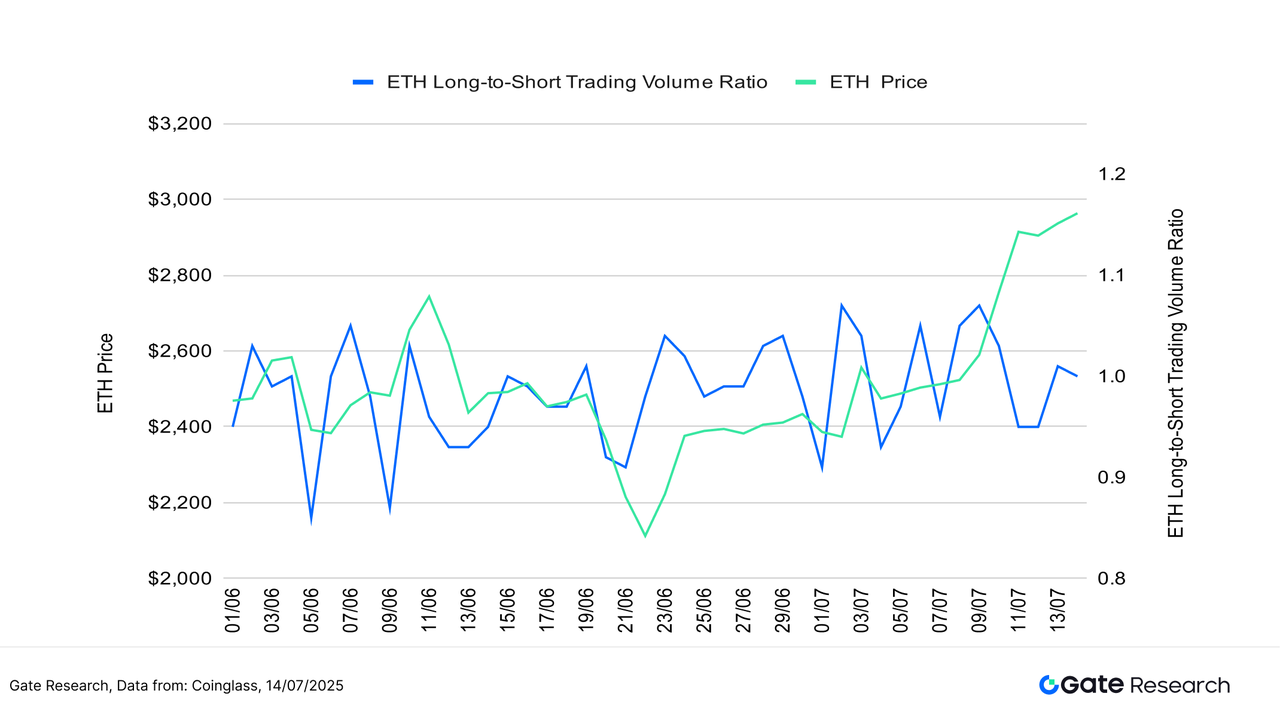
3. Open Interest Analysis
According to Coinglass data, open interest in BTC and ETH futures has risen significantly, indicating a clear rebound in overall market leverage participation. BTC open interest climbed rapidly from around $70 billion at the beginning of July to $86 billion, marking an increase of over 20%. Meanwhile, ETH open interest rose from approximately $33 billion to $42 billion, a nearly 30% gain. Notably, ETH’s open interest growth accelerated after July 5, repeatedly hitting new highs—suggesting that despite slowing spot momentum, leveraged traders have been actively positioning for a rebound. 【7】
Overall, both BTC and ETH are showing signs of rising leverage demand, driven by price appreciation and favorable policy catalysts. Market risk appetite appears to be recovering. However, it is worth noting that current open interest levels are approaching yearly highs. If price volatility increases in the near term, it could trigger concentrated liquidations or sharp price swings. Continued monitoring of leveraged positioning and liquidation risk is strongly recommended.
Figure 5: BTC and ETH futures open interest are both rising, signaling a clear recovery in market leverage participation.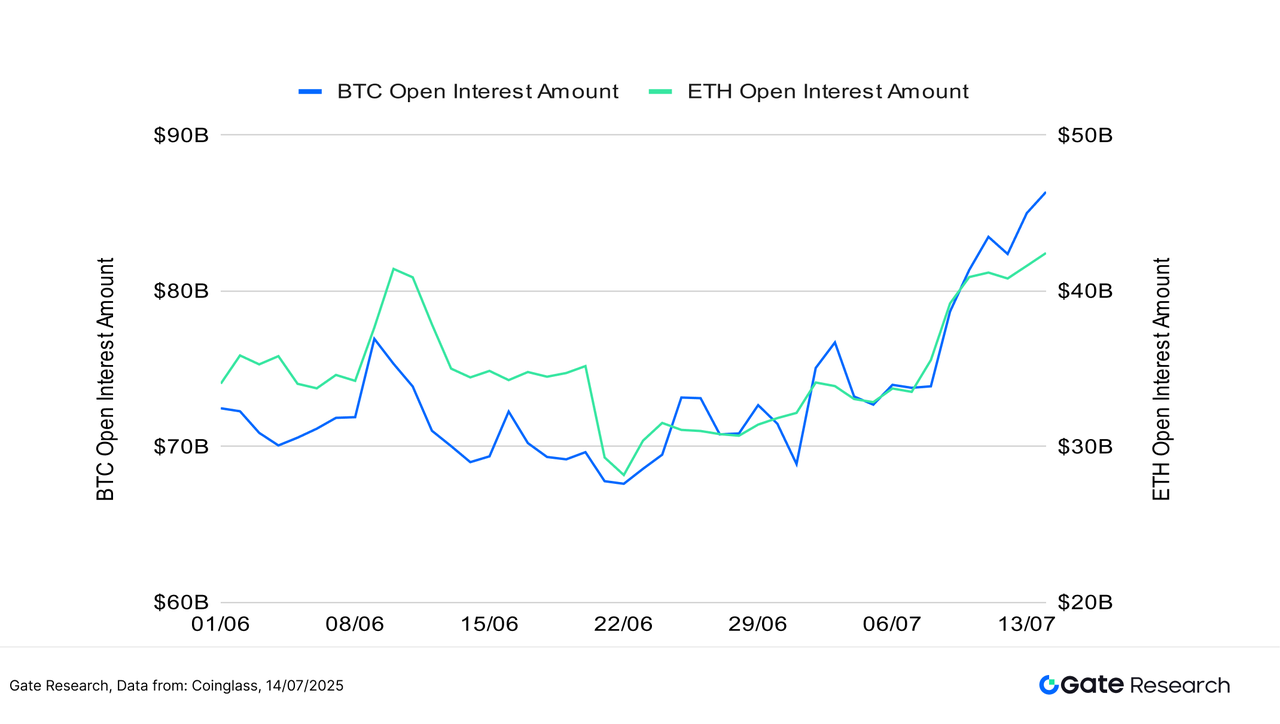
4. Funding Rate
Over the past two weeks, funding rates for BTC and ETH have hovered slightly above and below the neutral line, reflecting a stalemate between long and short forces in the market. Investors have shown restraint in chasing prices higher, and leveraged capital has not yet entered in full force. Despite the market’s upward trend, the lack of a significant increase in funding rates suggests that the rally is mainly driven by spot or low-leverage buying, rather than heavily leveraged long positions—helping to mitigate the risk of a short-term bubble and indicating a relatively healthy market structure. 【8】【9】
From a technical perspective, funding rates have occasionally dipped into negative territory but recovered quickly. This indicates that while short sellers have attempted to suppress prices, they have failed to exert sustained pressure or trigger large-scale liquidations—suggesting continued market resilience. Notably, between July 10 and 13, both BTC and ETH open interest rose steadily, yet funding rates remained modest—further confirming that recent position building is driven more by cautious capital than aggressive leverage.
Looking at funding rate behavior across assets, BTC’s funding rate has been more stable than ETH’s, underscoring its role as a “defensive market leader” favored by institutions and risk-averse capital. In contrast, ETH funding rates have been more volatile, reflecting greater market uncertainty and more frequent capital rotation—indicating that ETH remains more trading-driven in the current environment.
Overall, funding flows have not been a major bullish driver, but they also have not become a drag on price. If funding rates shift into sustained positive territory, accompanied by increased volume, it may act as a catalyst for further market breakout—a signal worth closely monitoring.
Figure 6: BTC and ETH funding rates have hovered near the neutral axis, indicating a market stalemate between long and short forces.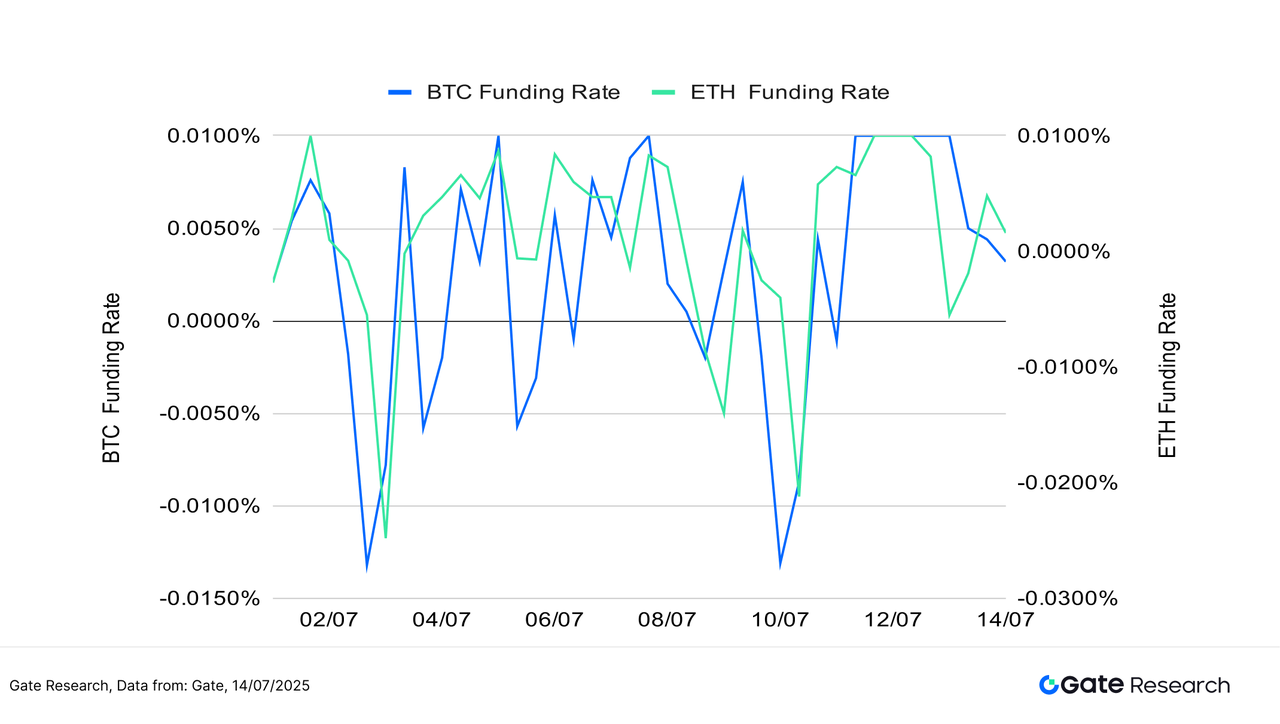
5. Cryptocurrency Liquidation Chart
According to Coinglass data, the past two weeks have shown a relatively orderly pattern of long-short positioning in the crypto market, with no signs of systemic imbalance or large-scale liquidations. Long liquidations remained relatively low and stable, indicating that bullish positions have been added cautiously. There has been no aggressive chasing, and leverage usage remains moderate. This suggests that the recent price increases have been largely driven by spot buying or steady accumulation, reducing the risk of cascading liquidations during potential high-level consolidation or pullbacks.
In contrast, short liquidations surged notably between July 9 and 13, especially on July 10, when both BTC and ETH experienced breakout rallies. On that day, short liquidations reached a local peak, nearing $1 billion, as bears were forced to close positions following failed downside bets. Such liquidation events typically occur during strong bullish breakouts, reflecting broader market recognition of upward momentum and providing crucial liquidity support for further price advances. Although short liquidations eased somewhat in the following days, they remained elevated, indicating that some market participants were still attempting to “short the top,” and bearish sentiment had not been fully washed out.【10】
Structurally, the current concentration of liquidations is not extreme. There remains a balanced tension between long and short positions, suggesting that while the market has a clear directional bias, it has not yet entered an overheated phase. These waves of short squeezes and gradual cleansing help build a more sustainable bullish foundation, enabling prices to rise on solid footing rather than experiencing sharp but short-lived spikes.
Overall, the current liquidation structure and derivatives market rhythm reflect a cautious but optimistic mindset among traders. While sentiment leans bullish, it is not excessively euphoric—supporting the potential for continued upward momentum in the near term.
Figure 7: On July 10, BTC and ETH both broke out sharply, with short liquidations reaching a local peak of nearly $1 billion.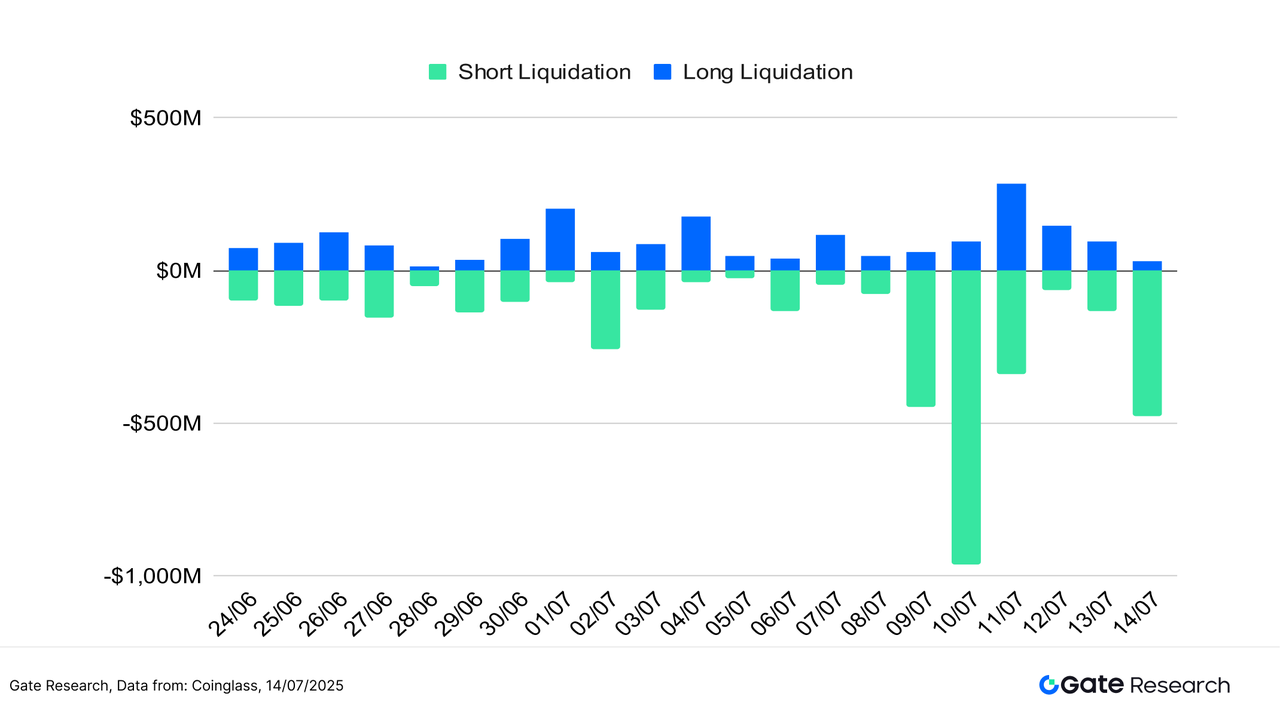
Against the backdrop of a structurally bullish market with cautious capital deployment, price trends may have continuation potential, but short-term volatility risks must also be considered. As market rhythm becomes increasingly fragmented, investors need more precise technical tools to manage trade timing and risk control. Therefore, the following content will focus on the ATR (Average True Range)—a key quantitative technical indicator—and explore its practical effectiveness in identifying entry points and stop-loss levels during choppy but upward-biased market conditions. Centered around the ATR Breakout Strategy, we will backtest its performance across different assets and volatility regimes to assess its adaptability and stability in both drawdown control and trend amplification.
Quantitative Analysis – ATR Breakout Strategy
(Disclaimer: All forecasts in this article are based on historical data and market trends and are for informational purposes only. They should not be considered investment advice or a guarantee of future market performance. Investors should carefully assess risks and make prudent decisions when engaging in related investments.)
1. Strategy Overview
This strategy is a short-term trend-following approach based on Average True Range (ATR or ADR), using breakout entries and static stop-loss/take-profit exits. ATR is a technical indicator introduced by Welles Wilder, designed to measure market volatility. It calculates the average of true ranges over a specified period, reflecting the intensity of price fluctuations, and is commonly used to determine entry timing and risk management thresholds.
The design of ATR takes into account price gaps and sharp movements. The True Range (TR) is defined as the maximum of the following three values:
- The difference between the current day’s high and low:
High-Low - The absolute difference between the current high and the previous close: |
High–Previous Close| - The absolute difference between the current low and the previous close: |
Low–Previous Close|
The ATR value is then calculated as the average of TR over the past N periods (commonly 14 days), serving as a quantitative measure of current market volatility.
The strategy uses this calculated volatility range to determine when price breaks above a “reasonable” threshold—interpreted as a signal that a trend may be emerging. Once triggered, the system enters a position and manages it with predefined fixed stop-loss and take-profit ratios to control risk and secure returns. By incorporating dynamic exit logic, the strategy aims to capture gains during trend continuations and limit losses in case of failed breakouts. It is particularly suited for short-term opportunities in range-bound or reversal-prone markets.
This backtest focuses on the top 10 cryptocurrencies by market capitalization (excluding stablecoins), covering major public chains and high-liquidity assets. It evaluates the strategy’s adaptability and practicality across different assets and market phases, verifying its viability and robustness for real-world deployment.
2. Core Parameter Settings
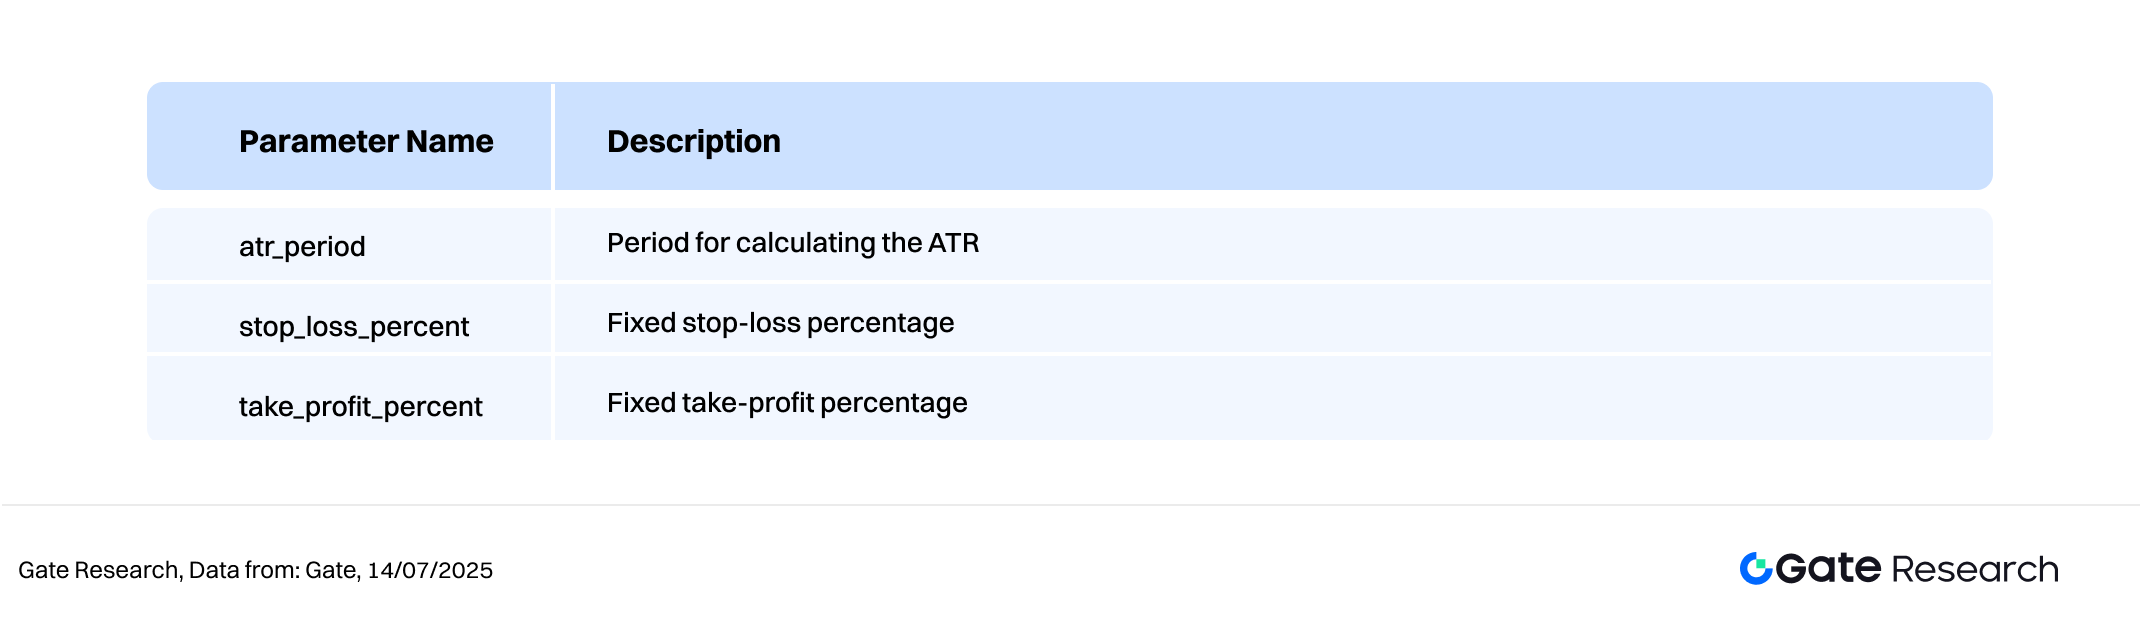
3. Strategy Logic and Operational Mechanism
Entry Condition
- When there is no existing position, a buy signal is triggered if the current closing price is greater than (daily low + ATR value based on
atr_period).
Exit Conditions
- ATR Pullback Exit: If the current price falls below (daily high - ATR based on
atr_period), the system considers the trend to be weakening and triggers a position exit. - Stop-Loss Exit: If the price drops to entry price × (1 -
stop_loss_percent), a forced stop-loss is triggered. - Take-Profit Exit: If the price rises to entry price × (1 +
take_profit_percent), the position is closed for profit.
Live Trade Example Chart
- Trade Signal Trigger
The chart below shows the 6-hour candlestick chart of XRP/USDT when the strategy triggered a long entry on July 9, 2025. The price broke above the dynamic upper boundary defined as “previous low + ATR,” effectively breaking out of the consolidation range. This met the strategy’s entry condition of “breaking above the intraday expected volatility range.” At the same time, the MA5 and MA10 moving averages formed a bullish crossover and trended upward, indicating strengthening short-term momentum. Trading volume also expanded alongside the breakout, confirming that the move was supported by buying pressure. After breaking away from the moving average cluster, the price showed signs of potential trend continuation. Based on these signals, the strategy initiated a long position, applying a static 1% stop-loss and a dynamic take-profit mechanism triggered by pullbacks from the recent high, aiming to capture the potential upward extension of the trend.
Figure 8: Illustration of XRP/USDT Strategy Entry Point (July 9, 2025)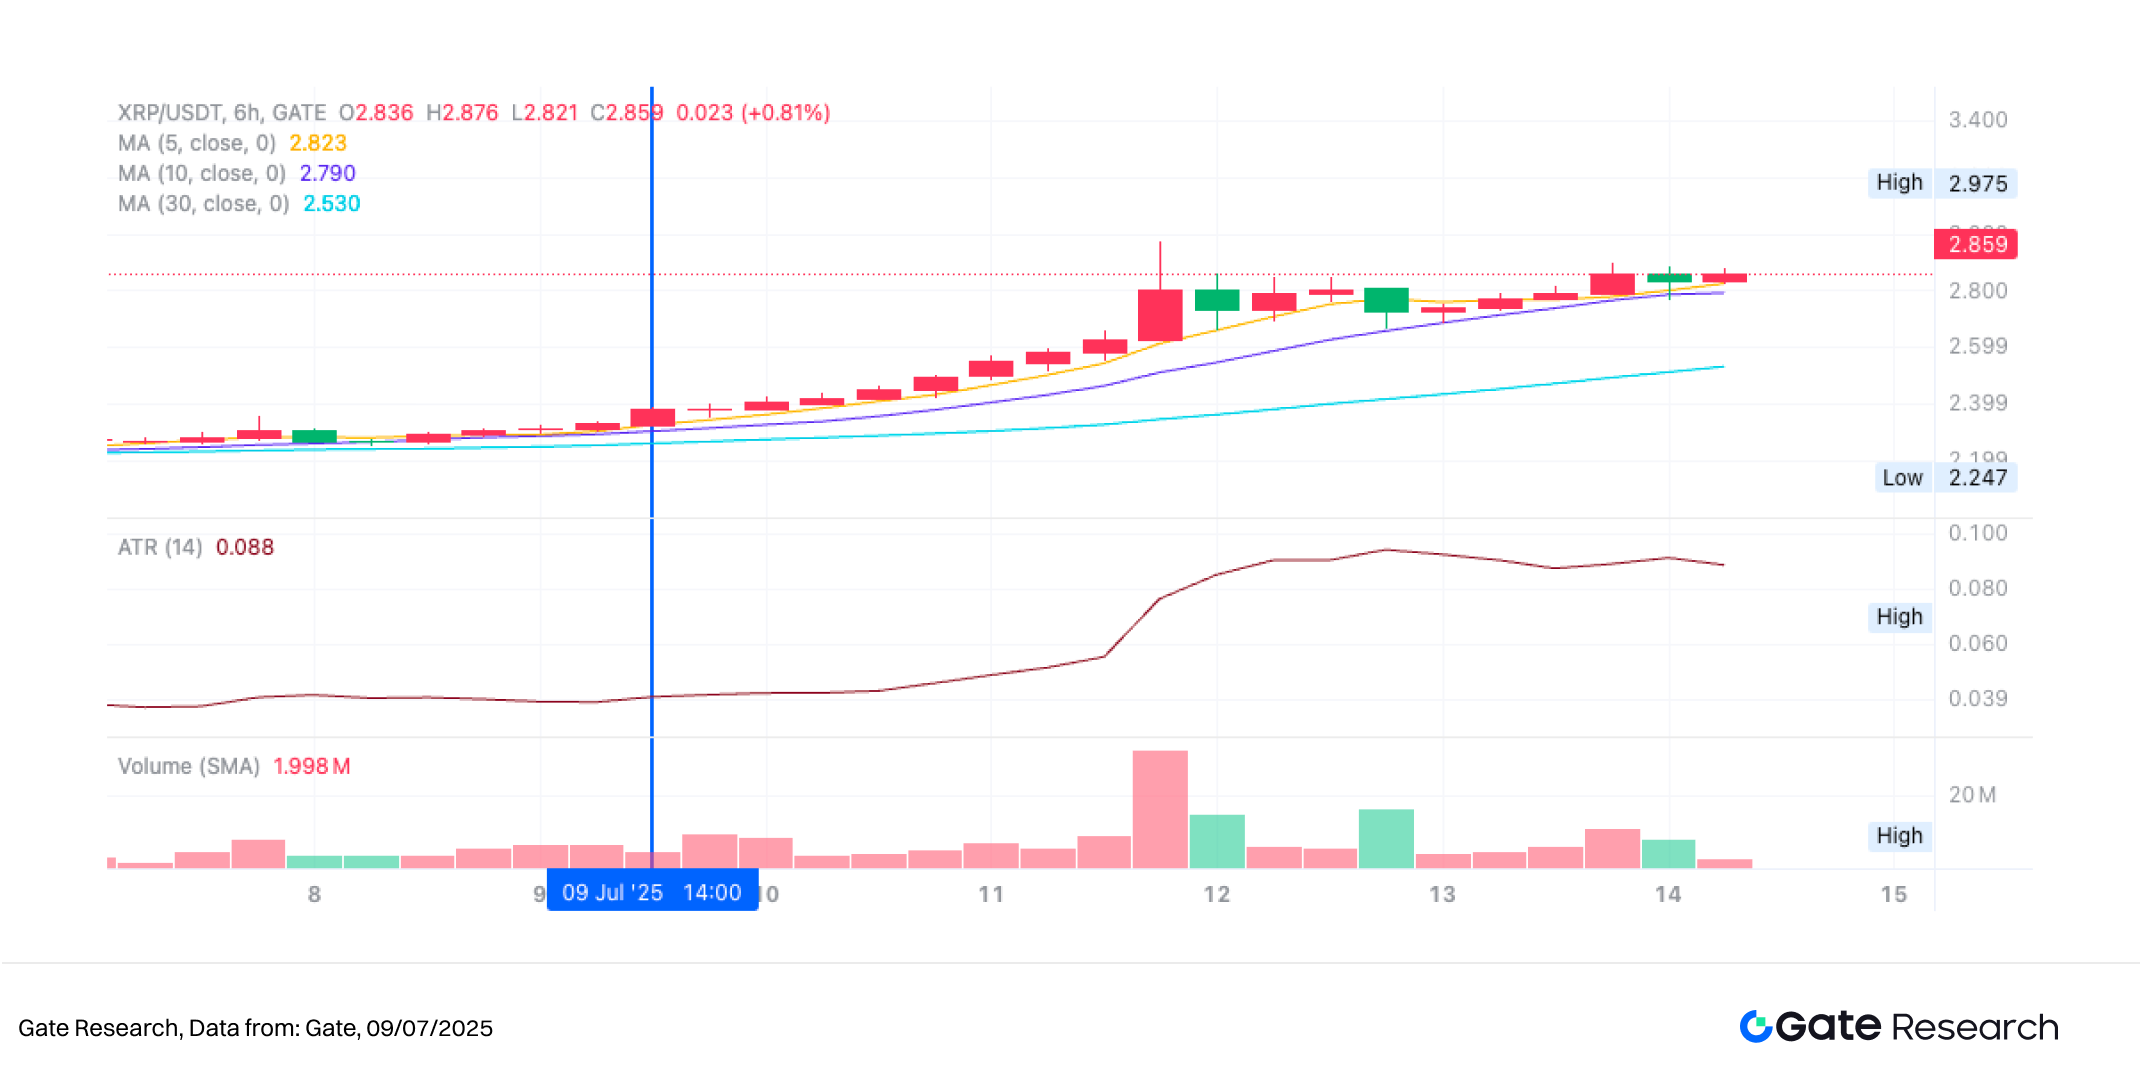
- Trading Action and Outcome
After a period of sustained gains, XRP reached a high of 2.975 USDT before entering a consolidation phase. As price action gradually weakened, it eventually broke below the strategy-defined dynamic support level of “recent high – ATR,” triggering the system’s automatic exit based on the ATR pullback condition. As shown in the chart, although short-term moving averages remained in a bullish formation, the uptrend had begun to lose momentum, with trading volume failing to expand—signaling a weakening of upward pressure.
This exit signal, based on “price falling below the ADR lower band”, is part of the strategy’s dynamic risk control mechanism. It effectively helps lock in profits from the earlier uptrend and avoids potential losses caused by high-level consolidation or trend reversals. Looking ahead, integrating dynamic take-profit rules or trend-following filters could further enhance holding efficiency and improve the strategy’s overall profitability and capital utilization.
Figure 9: Illustration of XRP/USDT Strategy Exit Point (July 12, 2025)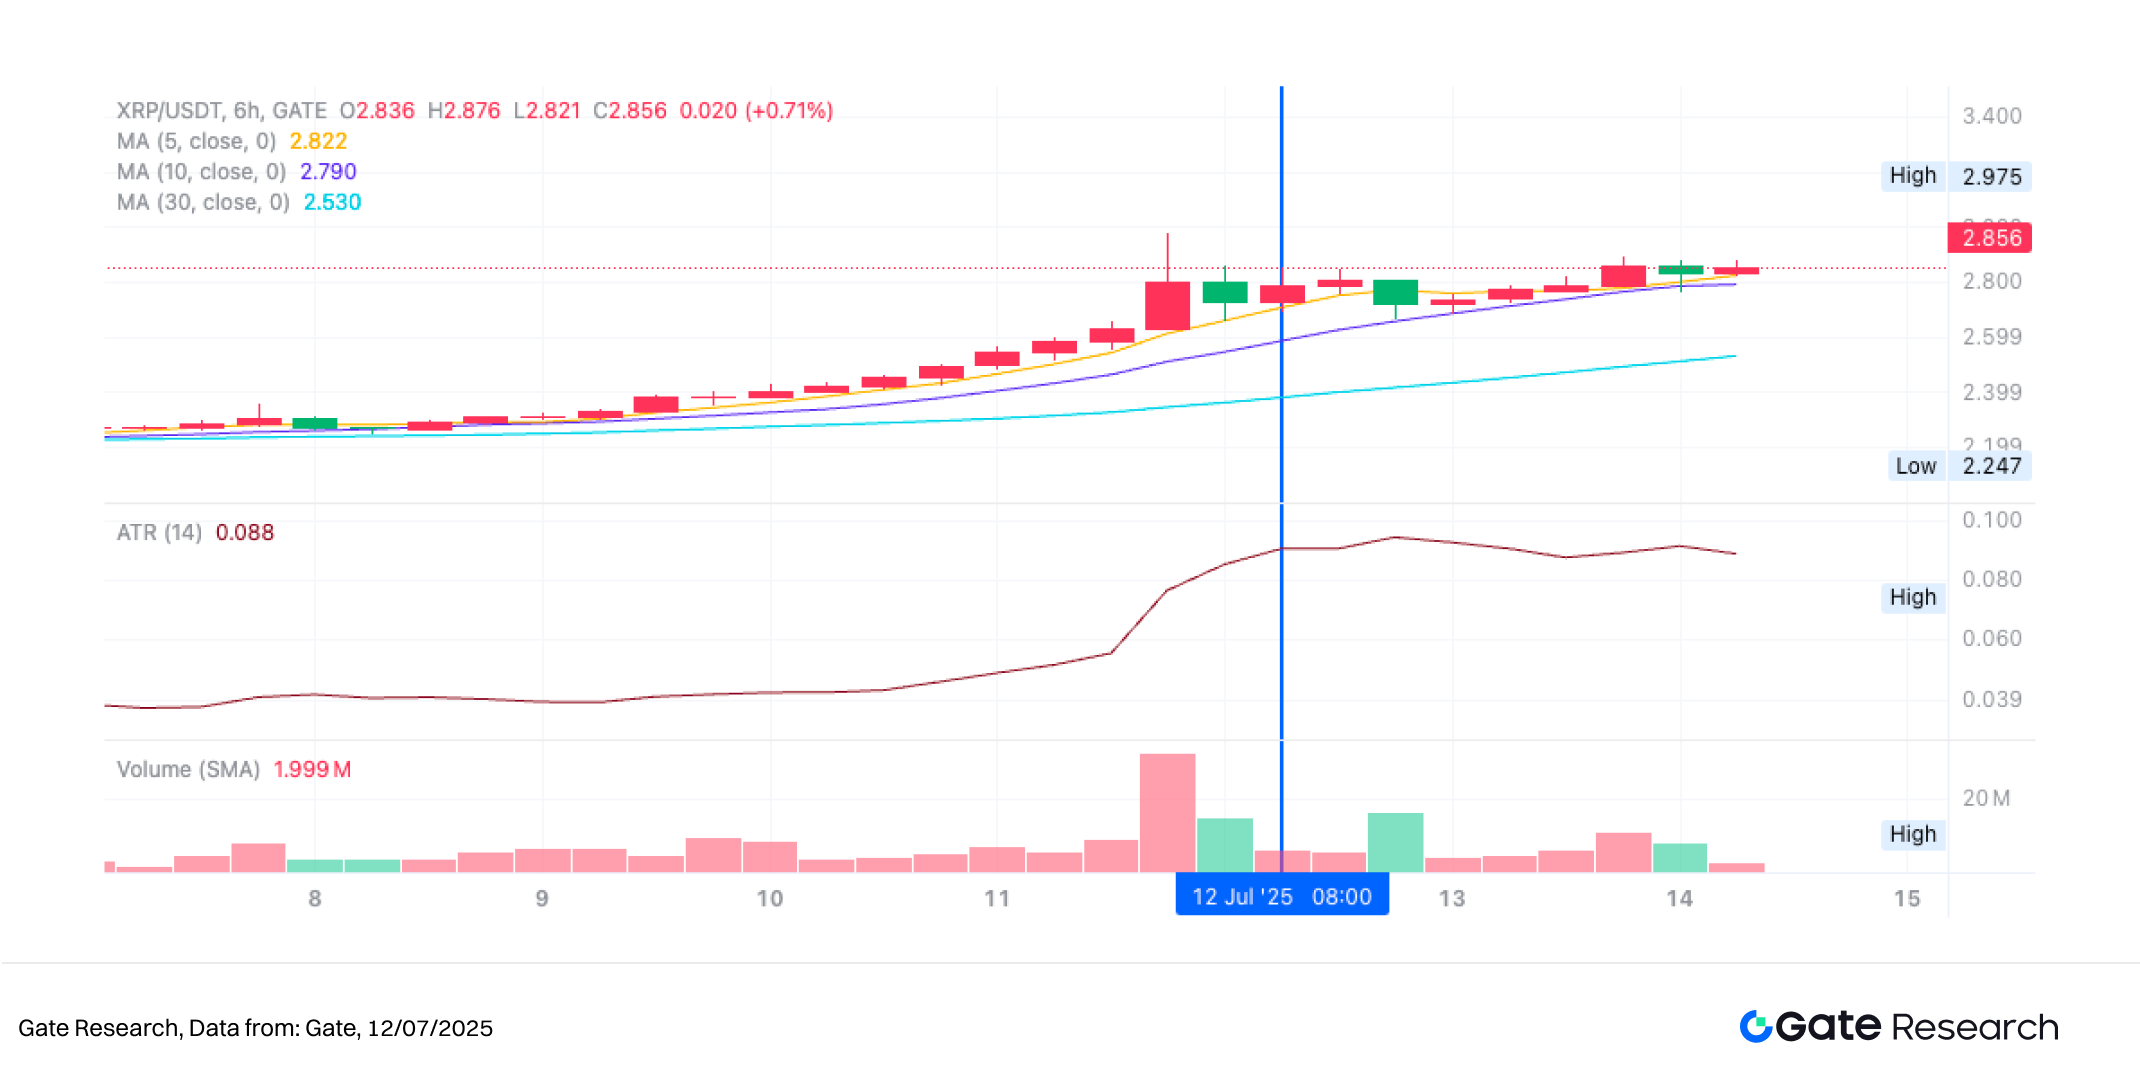
Through the above practical example, we demonstrated the entry and exit logic, along with the dynamic risk control mechanism, of an ATR-based breakout and pullback strategy in a trending market. The strategy uses the ATR indicator to assess reasonable volatility ranges, entering decisively when the price breaks above the upper boundary to capture early trend signals, and exiting when the price retraces to the support level defined as “recent high – ATR,” effectively locking in gains from the upward move.
While controlling drawdowns, the strategy also successfully avoids profit erosion caused by high-level price consolidation, showcasing its defensive capabilities and trading discipline during trend exhaustion phases. This case study not only validates the practicality and stability of the ATR strategy in live market conditions, but also provides an empirical foundation for future strategy enhancements—such as incorporating dynamic take-profit, trend-following elements, or multi-factor signal integration.
4. Practical Backtesting Example
Backtest Parameter Settings
To identify the optimal parameter combination, a systematic grid search was conducted across the following ranges:
atr_period:2 至 20(step size 1)stop_loss_percent:1% 至 2%(step size 0.5%)take_profit_percent:10% 至 16%(step size 5%)
Using 6-hour candlestick data from May 2024 to July 2025, this study backtested the strategy across the top 10 cryptocurrencies by market cap (excluding stablecoins). A total of 114 parameter combinations were tested, and the five best-performing sets were selected based on annualized return.
The evaluation criteria included annualized return, Sharpe ratio, maximum drawdown, and ROMAD (Return Over Maximum Drawdown), providing a comprehensive assessment of the strategy’s stability and risk-adjusted performance across different market conditions.
Figure 10: Performance Comparison of Top 5 Parameter Sets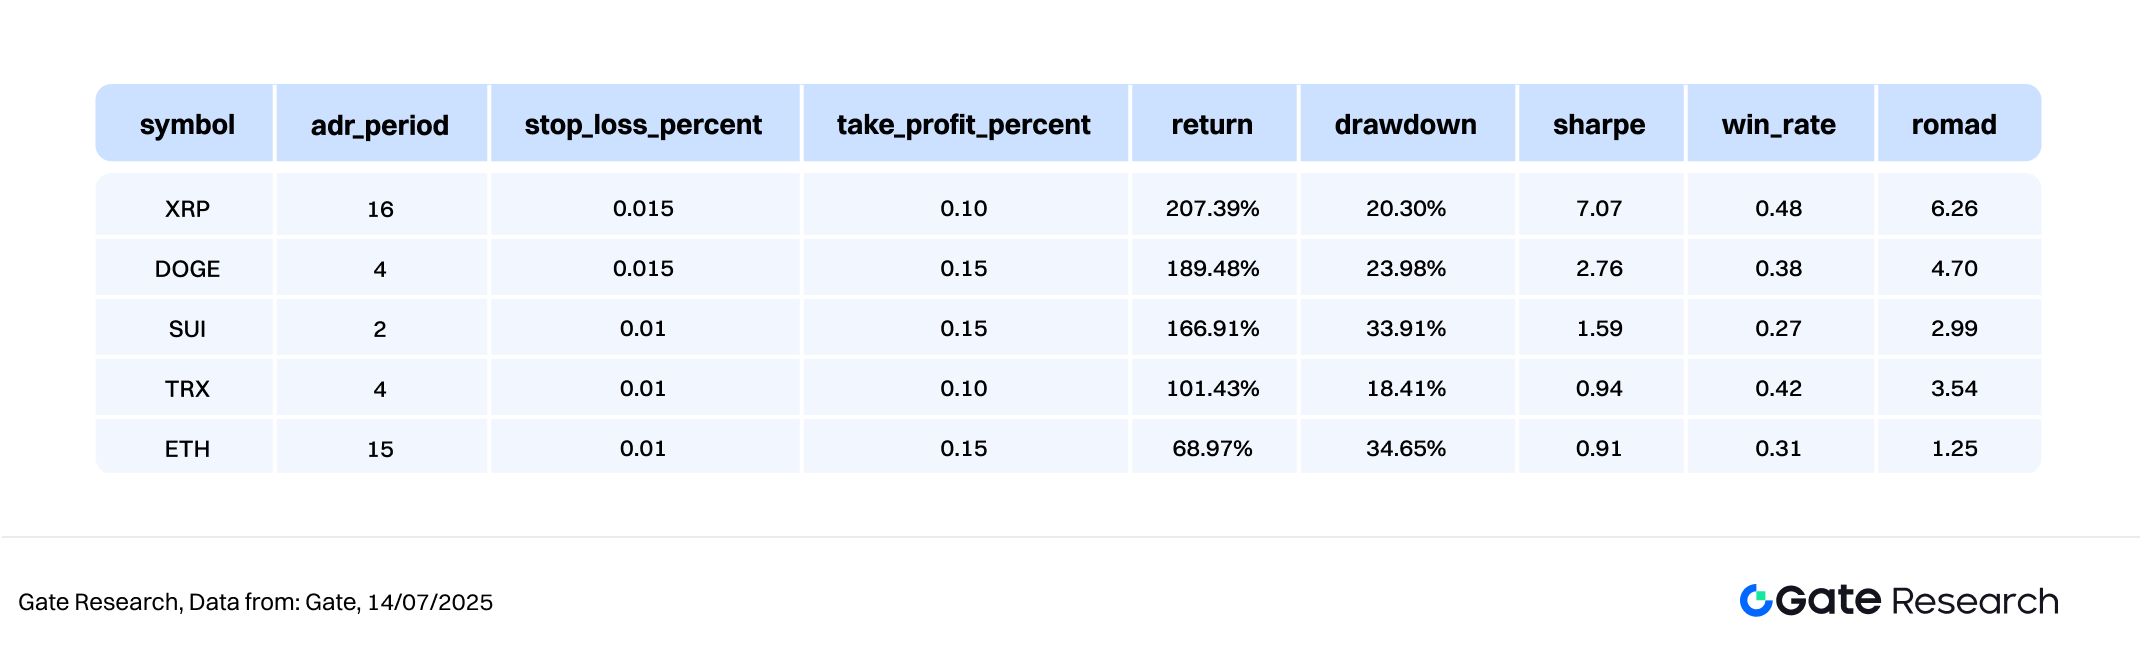
Strategy Logic Explanation
When the program detects a price breakout above the current low plus the ATR (Average True Range), which forms a dynamic upper channel, it signals the onset of short-term momentum. The strategy will immediately trigger a buy operation, aiming to capture early-stage trend breakouts. ATR is used to measure reasonable price volatility, and a strong breakout above this range is interpreted as a potential shift into a directional trend.
Once a position is entered, the system combines dynamic take-profit and fixed stop-loss mechanisms to enhance risk control. If the price later pulls back to the dynamic support zone defined as “recent high – ATR,” or if it reaches the preset stop-loss threshold, the system will automatically execute an exit to lock in profits or limit risk.
Using XRP as an example, the strategy parameters are set as follows:
atr_period\= 16(used to calculate price volatility)stop_loss_percent= 1%take_profit_percent= 10%
This logic integrates breakout signals with fixed-percentage risk management, making it well-suited for environments with clear trends and well-defined price swings. It helps capture upward momentum while effectively controlling drawdowns, enhancing both the stability and overall quality of trading returns.
Performance and Results Analysis
The backtesting period spans from May 2024 to July 2025, applying the ATR (Average True Range) breakout and pullback risk control logic to the top 10 cryptocurrencies by market cap (excluding stablecoins). The overall cumulative returns of the strategy were stable and consistently outperformed Buy and Hold strategies for BTC and ETH. As shown in the chart, strategy return curves for XRP, DOGE, and SUI exhibited sustained upward trends, each with cumulative gains exceeding 150%. The strategy repeatedly captured the early stages of short-term trends and successfully locked in profits through its pullback exit mechanism, demonstrating clear trade rhythm and disciplined risk control.
Among them, the XRP strategy stood out with a steady upward trajectory starting from October 2024, limited drawdowns, and long-term outperformance compared to other assets—ultimately achieving cumulative returns of over 200%. In contrast, BTC and ETH Buy and Hold strategies over the same period showed significant volatility, with ETH experiencing a maximum drawdown of over 50%. The ATR Breakout Strategy showed strong defensive capability during consolidation and correction phases, allowing for timely exits at local highs and avoiding deep pullbacks, resulting in steady capital growth. Furthermore, for TRX and ADA, while overall volatility remained relatively low, the strategies still delivered positive returns—demonstrating the robustness and adaptability of the ATR model across varying volatility profiles.
Overall, the ATR Breakout Strategy performed well in terms of profitability, drawdown resistance, and cross-asset applicability, suggesting strong potential for live deployment. Future enhancements may include integrating momentum indicators, volume-based signals, or trend confirmation mechanisms to improve entry quality and exit timing—further enhancing the strategy’s performance across different market structures.
Figure 11: Comparison of cumulative returns over the past year between five best-performing ATR strategies and Buy and Hold approaches for BTC and ETH.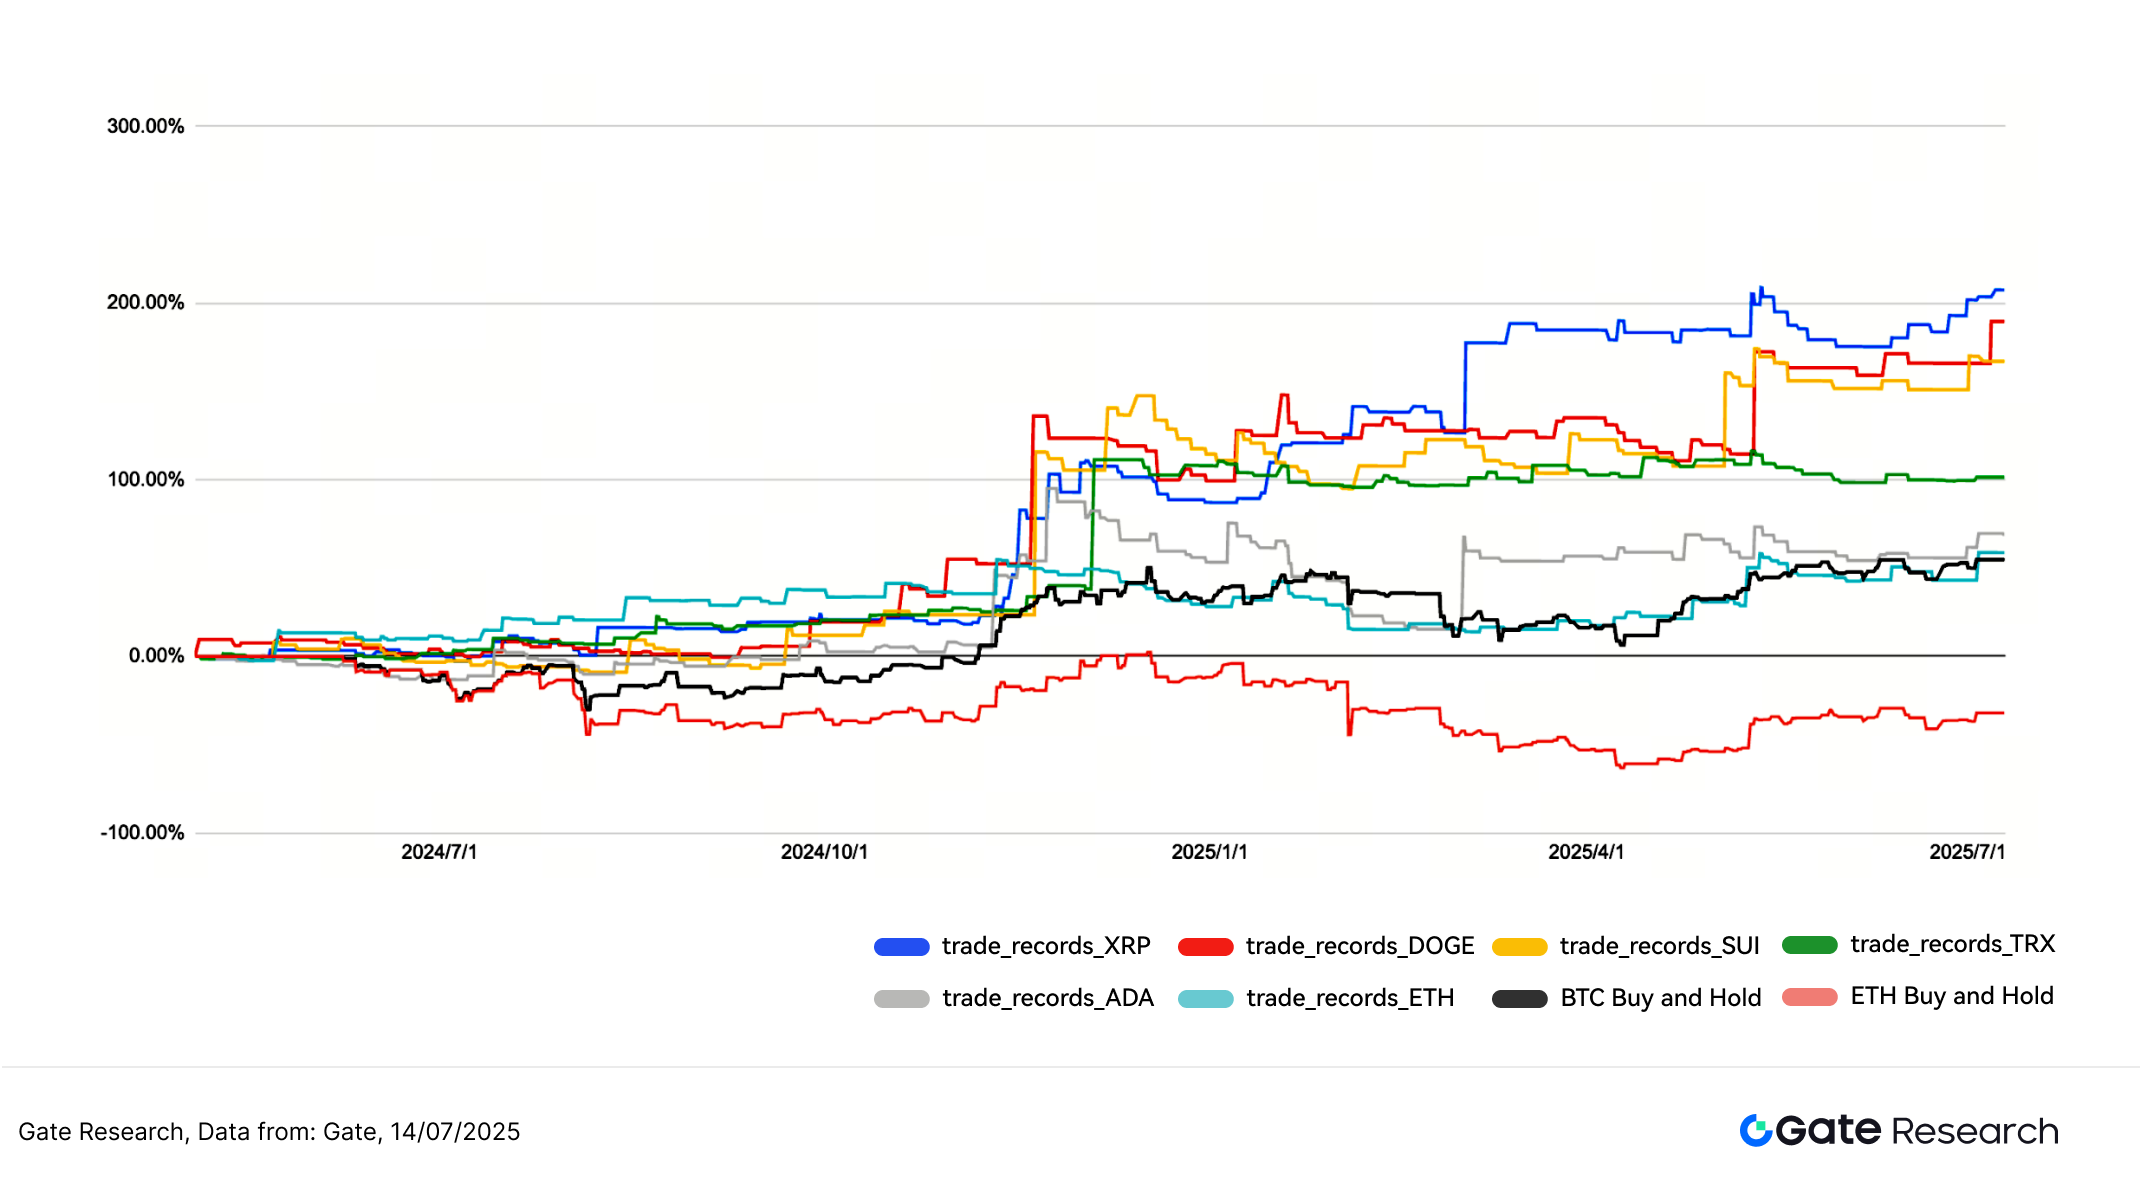
5. Strategy Summary
The ATR Breakout Strategy constructs dynamic breakout zones using the Average True Range (ATR), combined with fixed stop-loss and dynamic take-profit mechanisms. This approach has demonstrated strong risk control and stable return performance across a variety of major crypto assets. During backtesting, the strategy successfully captured the early stages of upward breakouts on multiple occasions, especially during periods of consolidation and trend reversals. Overall, its performance significantly outperformed traditional Buy and Hold strategies.
According to multi-asset backtest results, the strategy delivered outstanding returns on assets such as SUI, XRP, and DOGE, with maximum cumulative gains exceeding 200%. At the same time, it effectively avoided deep drawdowns observed in passive spot positions, such as in ETH, further validating the strategy’s adaptability and robustness in live market conditions. Notably, although the strategy’s win rate was generally below 50% across most assets, its asymmetric risk-reward structure and strict risk management allowed for consistent positive returns. Even under lower win-rate conditions, the strategy proved highly effective in controlling losses and managing position sizing, resulting in steady profit accumulation over time.
In summary, the ATR strategy strikes a well-balanced approach in managing drawdowns, improving trading efficiency, and optimizing capital deployment. It is particularly well-suited for high-volatility, high-uncertainty market environments. Going forward, the strategy could be enhanced by integrating Bollinger Bands, volume dynamics, or volatility filters to improve signal quality. It also holds strong potential to scale into multi-timeframe and multi-asset quantitative trading systems, further increasing its stability and scalability.
Conclusion
From July 1 to July 14, 2025, the crypto market maintained a moderately bullish tone overall. BTC, as the leading asset, demonstrated particular strength, with prices continuing to climb and repeatedly setting new all-time highs. Its technical structure and capital flows remained healthy, indicating that institutional and major players were actively positioning. In contrast, ETH stayed within an upward channel but showed a more sideways pattern with weaker trading momentum. Market confidence in ETH appeared subdued, with limited willingness to chase price highs. Analysis of long-short ratios and derivatives positioning showed BTC’s Long/Short Ratio (LSR) remained above 1 for most of the period, reflecting a neutral-to-bullish sentiment. ETH, on the other hand, exhibited more range-bound behavior, with a more cautious market stance. Open interest in both BTC and ETH futures rose steadily, with ETH showing a faster rate of increase, suggesting the market still anticipates potential catch-up performance from ETH. However, funding rates across the board hovered near zero, indicating that although there is some leverage interest, overall sentiment remains cautious.
In terms of liquidation structure, BTC’s breakouts above key levels were accompanied by significant short liquidations, which provided crucial liquidity for upward momentum. Long liquidations remained muted, indicating that the market’s buying pace was measured and structurally sound. On the policy front, July brought a series of favorable developments from the U.S., including the extension of tax cuts, clarification of crypto ETF review guidelines, and the launch of “Crypto Week” legislative activity. These moves have helped boost confidence in regulatory progress and a more favorable liquidity environment.Overall, the market structure appears robust with positive policy expectations. BTC continues its upward trend, while ETH still holds potential for a catch-up rally—but further upside would require stronger volume and improved market confidence. In the short term, traders should closely monitor funding rates and liquidation patterns as forward-looking indicators for trend continuation or risk release.
Against this backdrop—of structural bullishness but restrained capital deployment—price action shows potential for trend continuation, but short-term volatility risks remain. In such an environment, a volatility-based approach like the ATR (Average True Range) channel breakout strategy has shown strong medium-term trading performance. This strategy uses dynamic ATR-based range calculations to identify breakout signals, combined with fixed stop-loss and trailing take-profit mechanisms to manage risk effectively.
Backtesting results indicate the strategy performed particularly well on major tokens such as SUI, XRP, and DOGE, with maximum cumulative returns exceeding 200%, while maintaining controlled drawdowns. Despite win rates typically falling below 50%, the strategy’s clear exit rules and favorable risk-reward structure enable it to deliver consistently positive returns. In summary, the strategy strikes a strong balance between return potential, robustness, and execution efficiency, offering real-world applicability. With the integration of more quantitative factors and refined risk controls, it may achieve even better adaptability and scalability across multiple timeframes and token types.
References:
- CoinGecko, https://www.coingecko.com/
- Gate, https://www.gate.com/trade/BTC_USDT
- Gate, https://www.gate.com/trade/ETH_USDT
- tvbs, https://news.tvbs.com.tw/world/2920712
- Reuters, https://www.reuters.com/legal/government/us-secs-guidance-is-first-step-toward-rules-governing-crypto-etfs-2025-07-07/?utm_source=chatgpt.com
- Coinglass, https://www.coinglass.com/LongShortRatio
- Coinglass, https://www.coinglass.com/BitcoinOpenInterest?utm_source=chatgpt.com
- Gate, https://www.gate.com/futures_market_info/BTC_USD/capital_rate_history
- Gate, https://www.gate.com/futures/introduction/funding-rate-history?from=USDT-M&contract=ETH_USDT
- Coinglass, https://www.coinglass.com/pro/futures/Liquidations
Gate Research is a comprehensive blockchain and cryptocurrency research platform that provides deep content for readers, including technical analysis, market insights, industry research, trend forecasting, and macroeconomic policy analysis.
Disclaimer
Investing in cryptocurrency markets involves high risk. Users are advised to conduct their own research and fully understand the nature of the assets and products before making any investment decisions. Gate is not responsible for any losses or damages arising from such decisions.
Related articles

Gate Research: BTC Breaks $100K Milestone, November Crypto Trading Volume Exceeds $10 Trillion For First Time

Gate Research: 2024 Cryptocurrency Market Review and 2025 Trend Forecast

Gate Research-A Study on the Correlation Between Memecoin and Bitcoin Prices

Gate Research: Web3 Industry Funding Report - November 2024

Gate Research: October Crypto Market Review
